With Key Data Dashboard, property managers are able to track, analyze, and create action plans with their data in many different ways. With filtering abilities, you can view almost all reports filtered by preset selections such as bedroom size, sleep count, and amenities. We know that not all inventory is treated equally, so what happens when you want to see your data broken down more specifically to your inventory types?
We offer clients the ability to set up custom unit groups in their dashboard. This allows property managers to break out properties that are unique from the preset filter groups so you can analyze them. The more narrow the filtered data is, the richer the information becomes. With custom unit groups, you can evaluate performance within that group to see if any of your properties are an outlier or overachiever.
Breaking out your groups:
If you have more than 25 units, it can be hard to keep up with what the expectations should be for your property portfolio. Imagine trying to understand and track 75 individual units that are all so very different. If you can spend the time to break them up into smaller categories, then they will be easier to manage.
Here are some examples:
- 1-2 Bedroom Condos
- Lakefront Standard Homes
- First Row Beach Villas
Start simple - categorize by location and quality:
- Downtown GOLD: My top performers
- Downtown SILVER: Middle of the road
- Downtown BRONZE: Lower end inventory
In your Key Data Dashboard, create “Custom Unit Groups” for each of your categories - this will allow you to easily view, compare, and forecast performance. After creating your Custom Unit Groups, you can find them in the Filters section of the dashboard.
Setting up your custom groups:
There are two ways to set up your custom unit groups in Key Data. If you are starting simple and have some groups in mind for your properties you can use the instructions below. You can set up as many groups as you want and a unit can be placed in multiple unit groups.
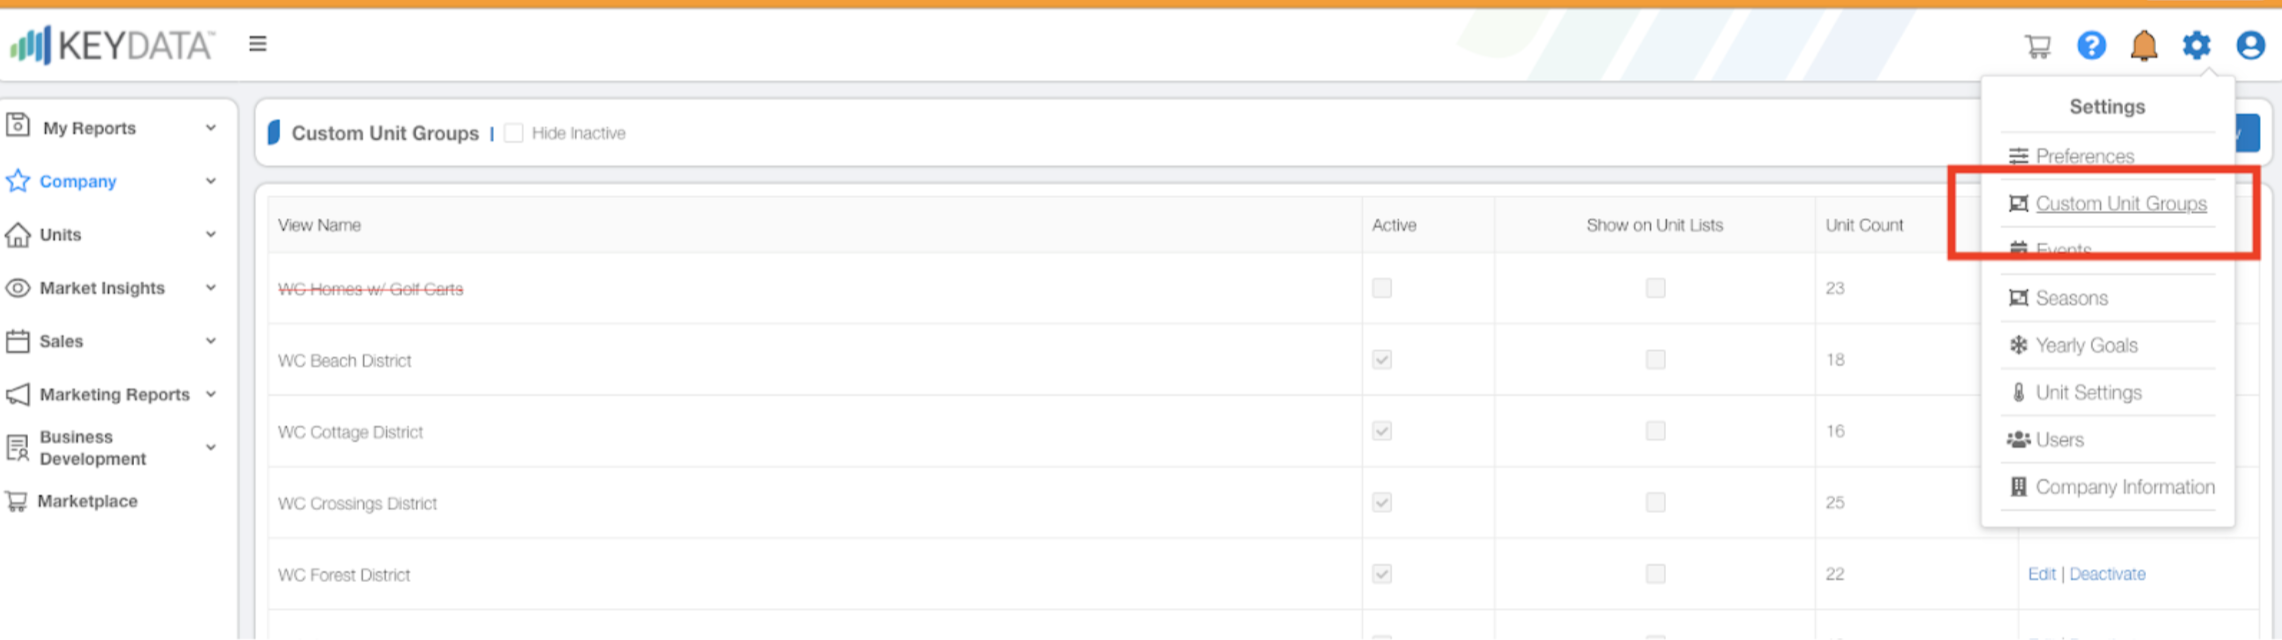
>>Settings
>>Custom Unit Groups
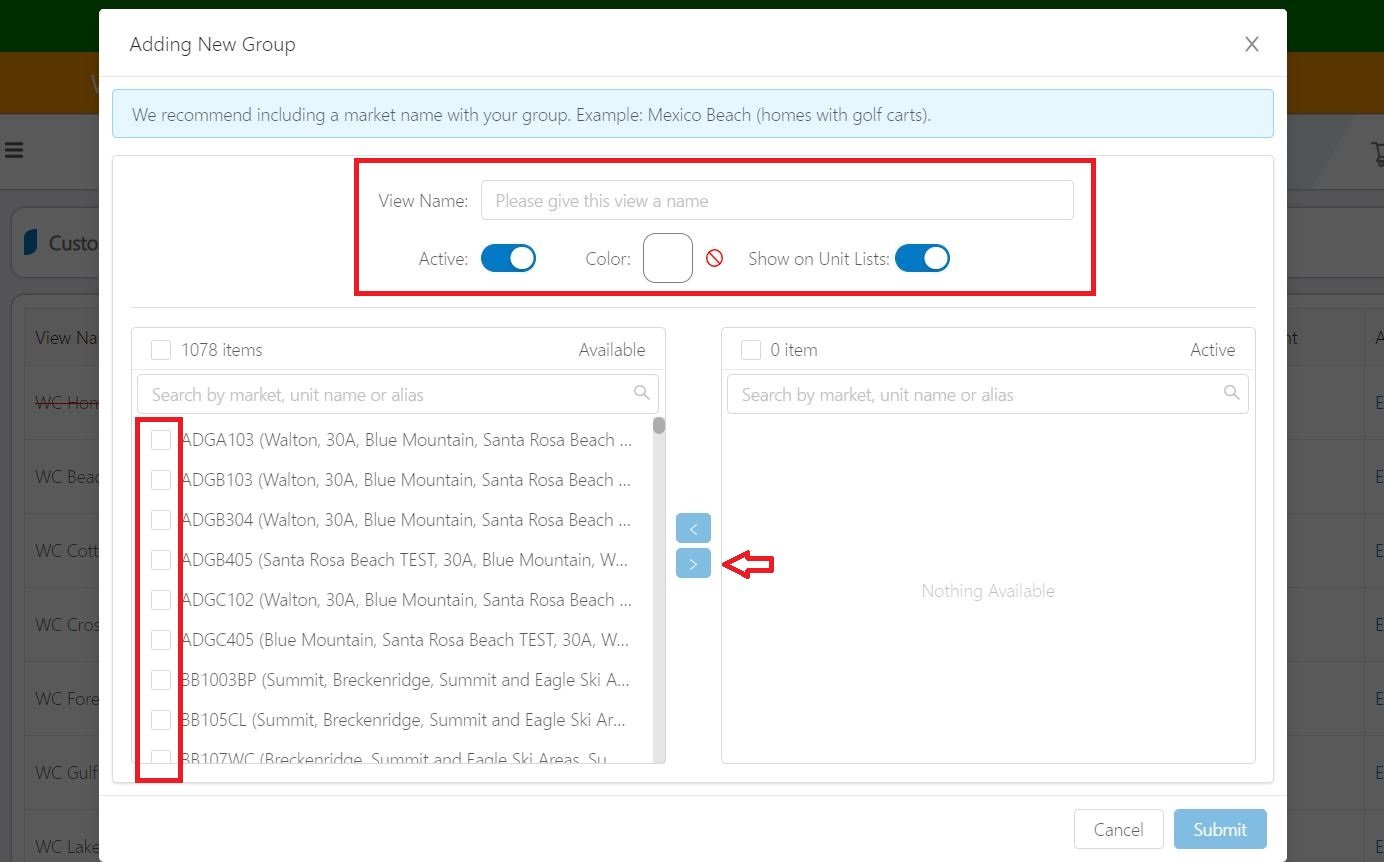
>>Add New
From here, you can give your new group a name (ex: Gulf Front Luxury Homes) and select the properties on the left that you want to add to the group. It is important to assign your custom unit group a color so you can easily differentiate between the groups in your reports.
The second way to set up a custom unit group is in the report sections “Units” >> “Leaderboard" >> "Report.” This report is often used for a deep analysis of property performance compared across two time frames. When using this report you might find that a particular group of properties is underperforming. In this case, it would be helpful to create a group for these properties so you can easily keep track of any change in performance.
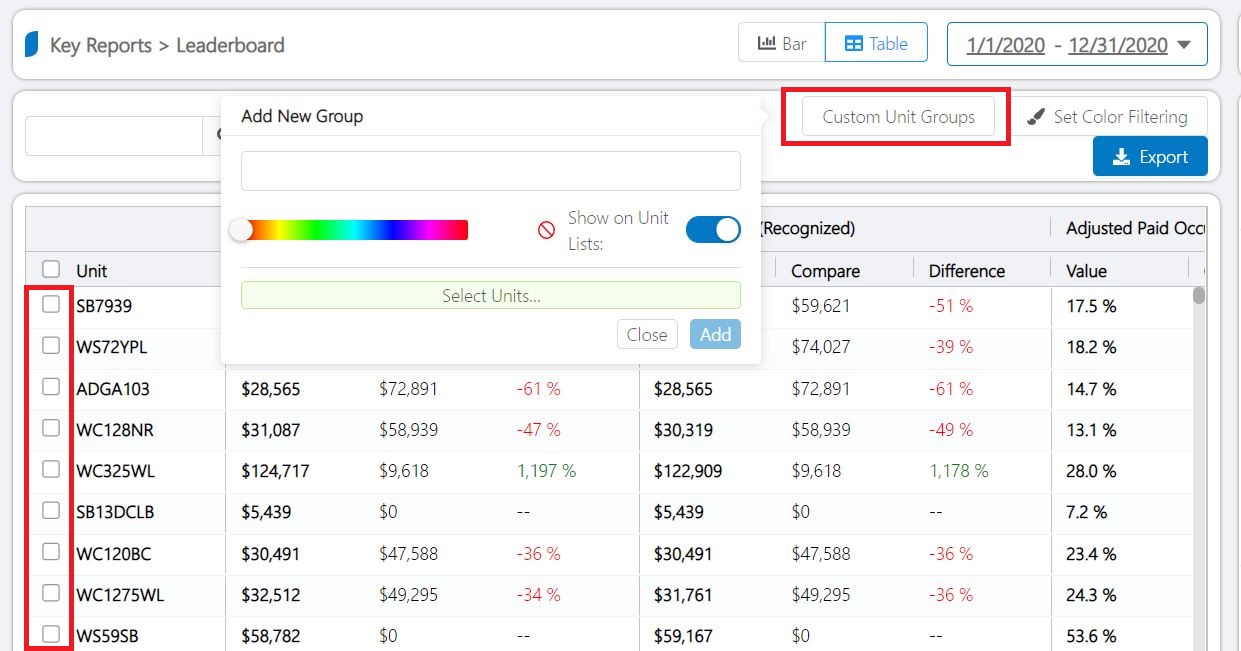
To create a new custom unit group from Leaderboard:
>> Select Custom Unit Group - located at the top of the chart
>> Select Add New or Add to Existing Group
>> For Add New - give your group a title and a color
>> Select Properties- use the checkboxes located next to the unit name
>> Select Add
Once you refresh this page the new custom unit group will appear in the filters.
How to use custom unit groups:
Custom unit groups are located in the filters section of all reports, excluding Market Insight Reports, Owner Report, and the Booking % Change by Date Report. Once you set up a few groups to get you started we recommend that you utilize the different reports in Key Data by filtering your custom unit groups.
Below are just a few key reports for analyzing custom groups.
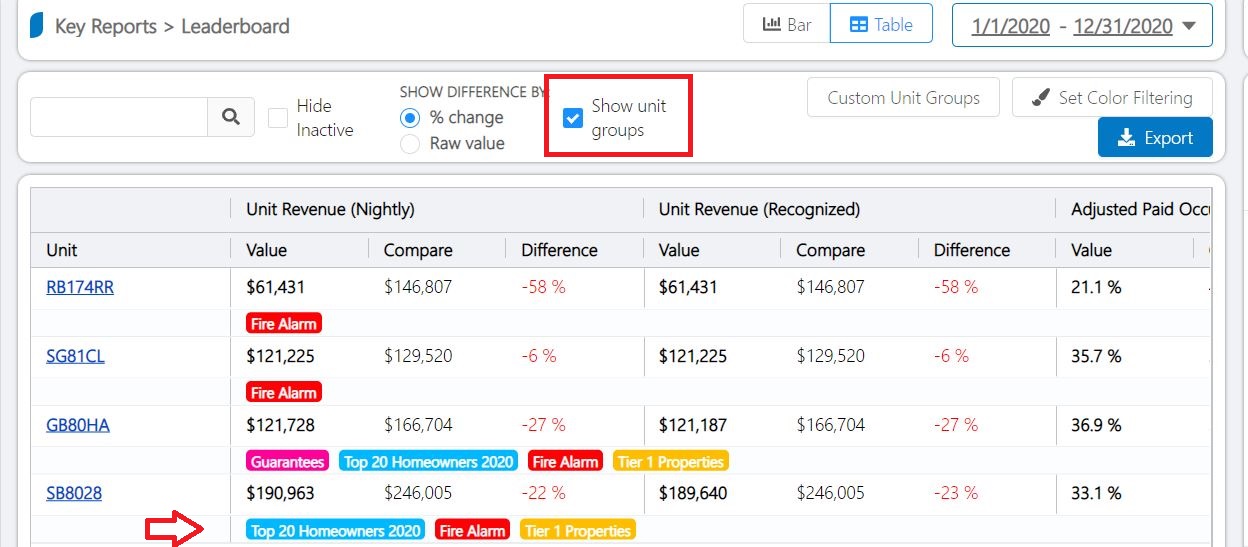
Leaderboard Report: Here you can track to see how your units overall or a custom unit group is performing against other units within that group.
In the example below, we are looking at properties filtered by the custom unit group “fire alarm” and we are filtering to only see 6 bedroom units within that unit group.
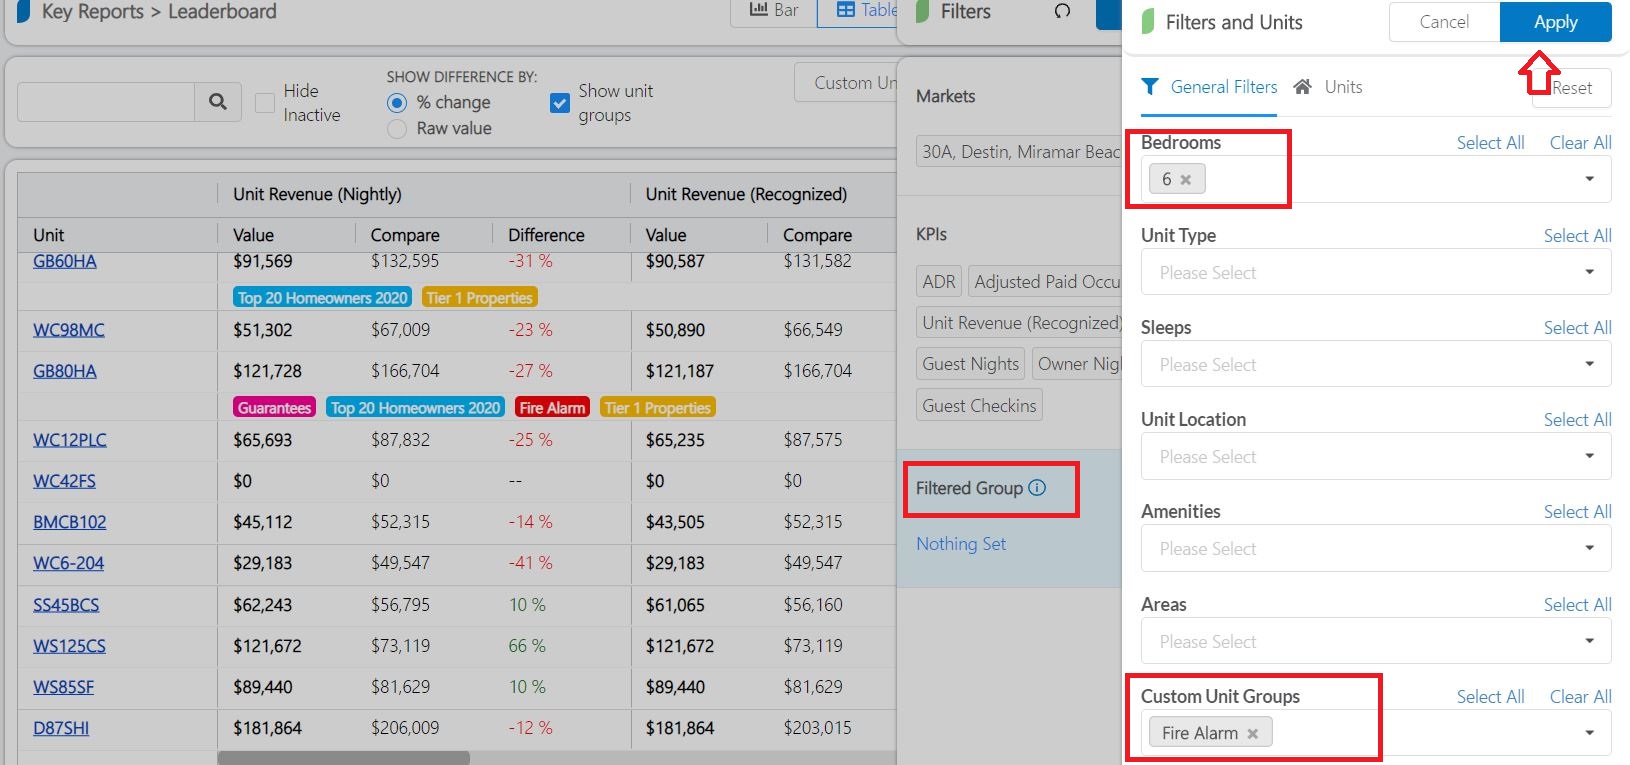
By Selecting to “Show Unit Groups” you can now see the filtered results and the colored and titled groups those properties are assigned to. Now you can evaluate how the 6 bedroom “fire alarm” units are performing.
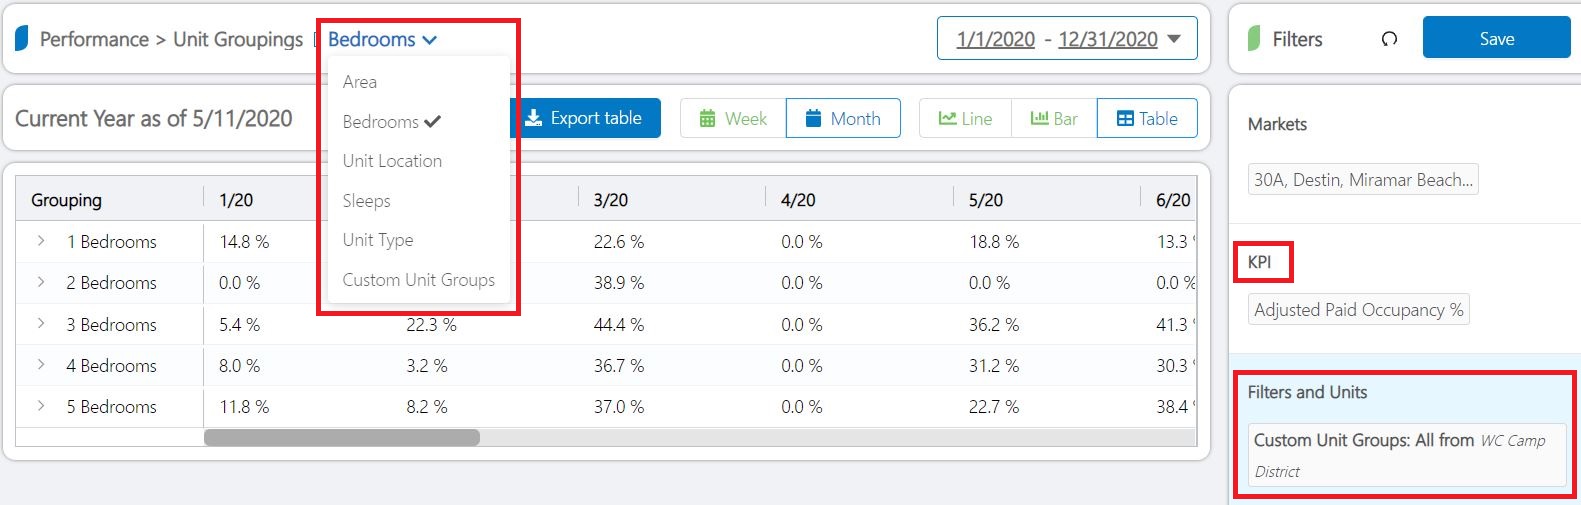
Unit Groupings: This report allows you to compare the performance of your customer units groups across time (month, week, or even day.) You can select your custom unit group using the filter and adjust your KPI to see how a specific custom unit group is doing based on bedroom size, sleep count, unit type, location, or area.
In the example below, we have selected to see the custom unit group “WC Camp District”, adjust paid occupancy by the month, and by bedroom size. Looking at this report you can track the occupancy performance within that specific custom unit group across different bedroom sizes. This helps you to establish if there is a particular bedroom type within that custom group that is outperforming or underperforming.